
.svg)
.svg)
.svg)
.svg)
.svg)
Part 1 of a 3 part series on how the lockdown is affecting our environment - and what we can do to extend the best part of these changes when the lockdown ends.
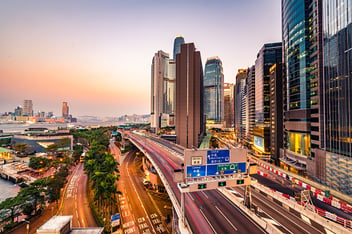
As we live through one of the biggest public health and social disasters in our era, there is a silver shining through the dark clouds. While people lock themselves in, small miracles are beginning to take place – the environment is healing. Rivers are healing and the air is getting cleaner. From dolphins to peacocks to deer, all of nature is gingerly stepping out to a cleaner and safer environment.
The Dauladhar range of the Himalayas is now visible from Jalandhar in the Indian state of Punjab, around 213 km away, for the first time in decades. This is attributed to decreased air pollution and greater visibility.

Let us talk numbers!
However, let us go beyond just a subjective and visual observation. To better understand our collective impact of the COVID-19 response, we need to talk numbers.
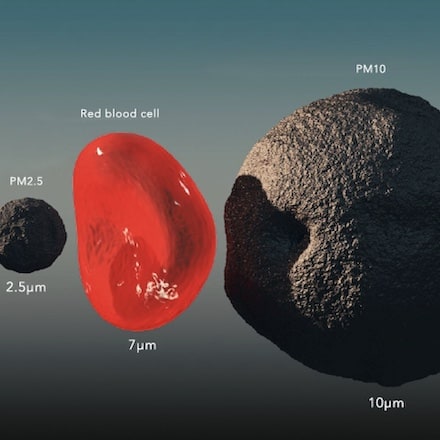
We looked closely at particulate matter pollution – less than 2.5 microns (PM2.5) and less than 10 microns (PM10) across 4 major cities in India. What we found was mind-blowing!
With the reductions of PM2.5 achieved just in the last week of March, a quick back-of-the-envelope calculation revealed that we have potentially saved 1,140 lives! In just 4 cities.
Extrapolating these numbers across the country, better air quality could potentially save 11,400 lives per month! [1]
In addition to lives saved, there are direct and indirect economic benefits in improved health and well-being of the population. A World Bank study reports that India lost 8.3% of its GDP on air pollution. The cost savings of cleaner air is significant.
A deeper look at the data
For the data-driven folks, here are some cool visuals on how our air looks compared to last year at the same time.
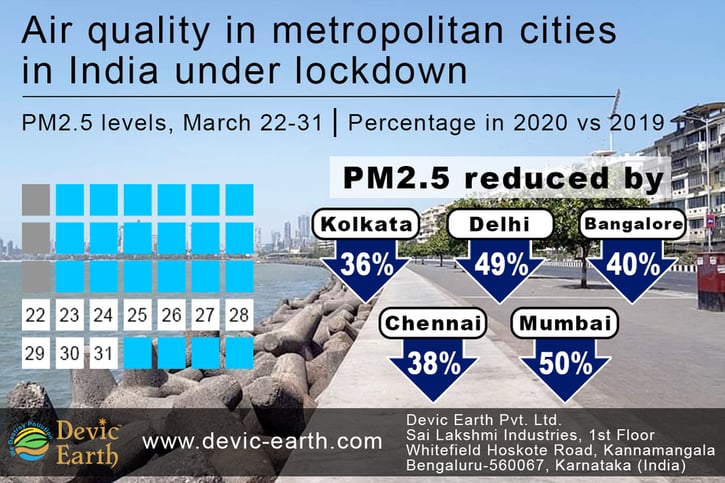
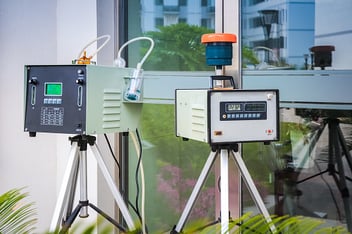
We compared the 2019 values during the last week of March with the 2020 values during the same time period. And the difference was striking. Across the metros, PM2.5 values have gone down significantly, up to 60% in places like Delhi. The heatmap below gives you a picture of the air quality in the metro cities during the last week of March in 2019 and the air quality during the last week of March 2020.
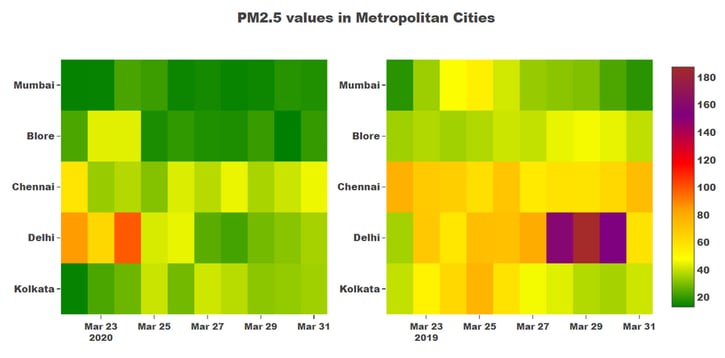
Figure 1. Heatmap of PM2.5 values during the last week of March in 2019 and 2020 across 4 metropolitan cities. Data source: CPCB monitors
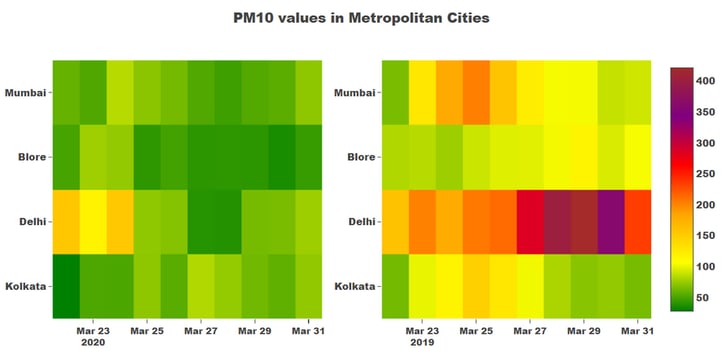
Figure 2. Heatmap of PM10 values during the last week of March in 2019 and 2020 across 4 metropolitan cities. Data source: CPCB monitors
The dark green is the zone to be in, where the PM2.5 values are below the WHO guidelines, which is 25 µg/m3 and PM10 is below 50 µg/m3. In India, PM2.5 values up to 60 µg/m3 and PM10 values up to 100 µg/m3 are considered safe. Anything above that is harmful to health.
The charts below compare the average PM2.5 and PM10 levels in the 5 metropolitan cities in 2019 vs 2020. The difference is stark!
Average PM2.5 values decreased from 57 µg/m3 to 42 µg/m3, while PM10 values are down from 145 µg/m3 to 62 µg/m3.
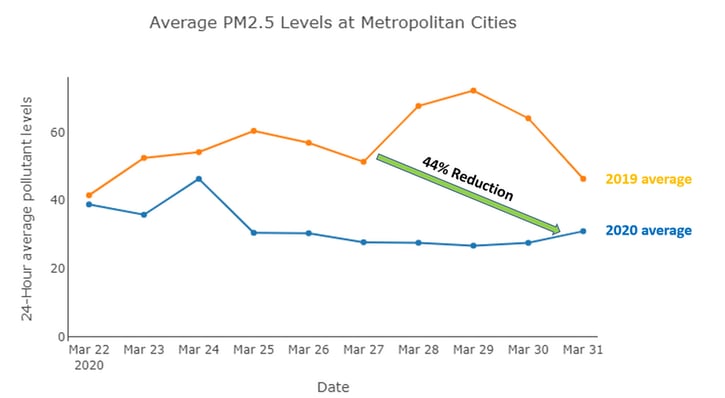
Figure 3. Average PM2.5 levels across 4 metropolitan cities in 2019 and 2020. Data Source: CPCB monitors
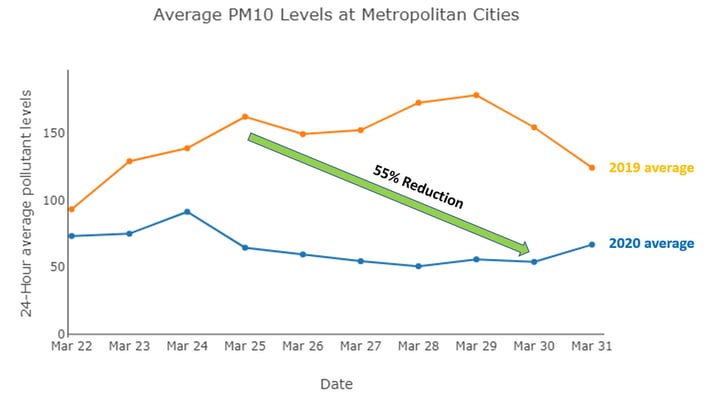
Figure 4. Average PM10 levels across 4 metropolitan cities in 2019 and 2020. Data Source: CPCB monitors
What’s the lesson here?
Of course, it is irresponsible and incorrect to extoll the virtues of lockdowns under such circumstances. These numbers just serve to reflect on the way forward.
Perhaps COVID-19 can offer some important lessons on making choices. Perhaps there are less polluting ways of doing what we do currently. Perhaps there are ways to reduce air pollution without impacting the economy.
While the initial numbers are compelling, we will continue to analyze and understand the impacts of the COVID-19 response on the air quality. Please watch this space as we discuss possible solutions that can play a compelling role in maintaining these air pollution levels even as we survive and come out of this pandemic.
.webp?width=1080&height=1080&name=Free%20Case%20Study%20Steel%20Plant%20(1).webp)


Post Comments