
.svg)
.svg)
.svg)
.svg)
.svg)

With that, the demand for energy, transportation, and infrastructure development has skyrocketed. Several studies have shown the detrimental effects of air pollution on human health and well-being. Among all the air pollutants, particulate matter (PM) pollution is of particular concern.
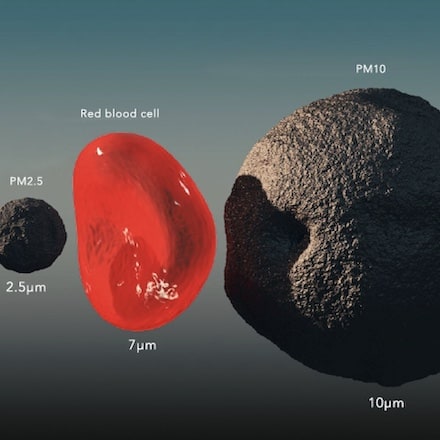
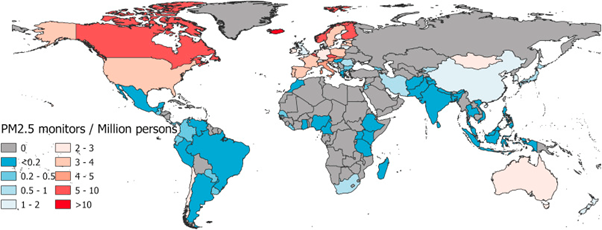
Particulate matter (PM) is further classified into PM2.5 and PM10, based upon their particle diameter. However, various researches have shown that we still do not have enough PM2.5 and PM10 outdoor air quality monitoring devices to create a representative picture of PM pollution.
Due to their tiny size, they can penetrate deep into the lungs and mix with the bloodstream. Chronic exposure to such a high level of particulate matter concentration is conducive to various cardiovascular and pulmonary diseases.
Therefore, the number of PM2.5 and PM10 air quality monitors has increased in the past few years to monitor particulate concentration accurately. You can read more about particulate matter in the knowledge bank section.
WHY MONITOR PM2.5 AND PM10?
You must have encountered this question about why precisely PM10 and PM2 5 monitoring is important? To understand that, first, we must address what particulate matter is and how is particulate matter measured?
What are Characteristics of Particles of Matter?
So, what are the characteristics of particles of matter? According to USEPA, particulate matter (commonly referred to as PM) is a mixture of solid particles and liquid droplets found in the air. Some particles like dust and dirt are visible to the naked eye, and some are so small that one can only observe with a microscope. Together they are responsible for all the particulate pollution that we experience every day.
The effects of particulate matter on human health depend upon their particle diameter, and that’s why monitoring different particle sizes like PM2.5 and PM10 becomes critical.
Sources of Particulate Matter - Where Does it Comes From
PM10 and PM2.5 have less than an effective aerodynamic diameter of 10 micrometers and 2.5 micrometers, respectively. Therefore, all combustion activities, including vehicular emission and forest fires, are significant sources of particulate matter (PM).
Secondary complex reactions with other pollutants such as sulfur dioxide and nitrogen oxides, present abundantly, are also the indirect sources of particulate matter. In addition, construction and mining activities, unpaved roads account for dust and particulate pollution.
Therefore, dust monitoring at such sites is crucial to quantify the source contribution and PM size distribution.
It is essential to formalize their particle diameter to develop control standards based on them. Therefore, samples collected from PM air quality monitors were analyzed for particle size distribution.
The results showed that distribution patterns exhibit peaks around 2.5 and 10 micrometers. These are known as particle distribution modes of PM monitors.
PM MEASUREMENT TO UNDERSTAND THE PROBLEM OF AIR POLLUTION
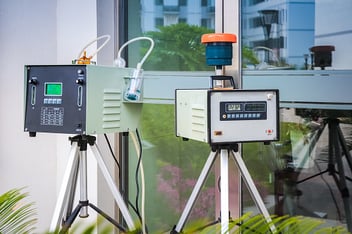
There is a famous saying that – “you cannot manage what you cannot measure.” PM air monitoring equipment fulfills the requirement of measuring particulate matter concentration.
However, the deployment of PM monitors does not solve the problem by itself.
Instead, PM10 and PM2 5 monitoring concentrations serve as the basis of pollution abatement strategies. It provides essential insights and relevant information that helps us define the pollution problem to solve it.
PM monitors also enable us to track the progress of mitigation strategies by assessing the efficacy and efficiency of policy intervention. With such information, we can fine-tune our response to reduce exposure to PM2.5 and PM10.
Emission sources, topography, and meteorological conditions are principal factors governing air pollution. Due to region-specific factors, the distribution and extent of pollution are different everywhere.
Therefore, it is imperative to define the pollution problem of the region of interest to reduce PM concentration levels. Monitoring PM2.5 and PM10 concentrations also enable us to carry out long-term trend analysis.
Recently CPCB’s National Ambient Air Quality Status & Trends report showed that while 78% of cities exceeded PM10 standards, PM2.5 concentrations in the last three years.
Another report, named ‘Impact of Lockdown on Ambient Air Quality,’ showed an unusually high ratio of PM2.5 to PM10, attributing the source of the pollution to biomass burning and cooking fuel.
Other studies have attempted to accurately attribute a percent increase in PM2.5 and PM10 concentration near roads by placing multiple PM monitors around roads and highways.
A robust PM monitoring system plays a vital role as such analyses are only possible with accurate PM10 and PM2.5 monitoring data. Also, accurate data further enables a practical policy framework.
PM2.5 and PM10 MONITORS TO REDUCE POLLUTION EXPOSURE
Day-to-day activities result in the majority of PM2.5 and PM10 emissions which makes PM pollution a global issue. It is corroborated with a study carried out by the World Health Organization (WHO).
It states that 9 out of 10 people worldwide breathe air containing high levels of PM pollutants. As a result, air pollution (particularly PM2.5 and PM10) contributes to 7 million premature deaths worldwide.
Out of which, 1.2 million Indians lost their lives prematurely, according to the Global Burden of Disease Study 2015. The data translates to global economic losses of US$ 3 trillion according to the OECD Report, of which India bears US$ 150 billion in monetary losses, according to Greenpeace Southeast Asia report.
Economic losses are due to lost productivity and increased expenditure in healthcare. Such analyses are carried out using concentration-response relationships.
It shows the percent change to various changes in various health metrics brought by the percent change in pollution concentration. PM monitoring devices provide crucial datasets to develop such relationships. The study of the concentration-response relationship for PM2.5 and PM10 helps understand PM pollution reduction’s economic co-benefits.
It also helps calculate return on investment (ROI) value during the economic feasibility of the air pollution abatement plan. Highly accurate PM monitoring systems are a prerequisite to facilitate such planning. Capacity building by increasing PM air quality monitors will pay back with improved productivity and reduced healthcare spending.
Resultantly, the benefits of air pollution reduction will significantly outweigh costs, as per TERI’s research. Moreover, such pollution abatement strategies, built upon PM monitors’ data, can effectively reduce people’s exposure to PM2.5 and PM10.
PM MONITORING TO ACHIEVE VARIOUS NATIONAL AND INTERNATIONAL GOALS
Particulate air pollution is a global issue. Existing networks of PM10 and PM2.5 monitors have shown that PM concentrations have increased manifold around the world in the past few years. Severe health and economic implications resulted in various international agreements.
The Paris Agreement of 2015 is one of such critical international agreements. Member Countries agreed on the Sustainable Development Goals and the arrangement of reducing greenhouse gas emissions worldwide.
The SDG3 of healthy lives and well-being and SDG11 of sustainable cities mandate to increase the number of PM monitors around the world. The SDGs give well-needed emphasis on PM2.5 and PM10 monitoring and their reduction to achieve the overall target of sustainable development.
Similarly, in India, the National Air Quality Monitoring Programme (NAMP) identified the limitation of inadequate PM monitoring systems. National Clean Air Programme (NCAP) is a target to attain targets of national ambient air quality standards (NAAQS).
It has also allocated a budget to expand the networks of PM monitors. Along with monitoring PM pollutants, it addresses the institutional and administrative aspects of air pollution reduction.
OIZOM’S PARTICULATE MATTER (PM) MONITORS
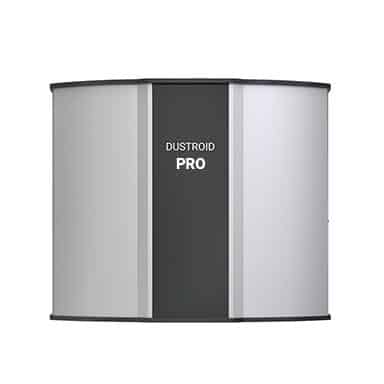
Oizom’s Dustroid – dust monitoring device precisely measures high particulate pollution loads experienced at mining and construction sites. Oizom’s Polludrone measures gaseous pollutants along with particulate pollutants (PM1, PM2.5, PM10). Both the PM monitors also measure meteorological parameters such as temperature, humidity, wind speed, and wind direction. OIZOM’s devices provide high-quality monitoring data at an economical cost. Further data integration with various platforms results in the generation of dynamic pollution maps.
OIZOM’s PM monitors are a perfect choice for monitoring PM2.5 and PM10 concentration at airports, roads and highways, and underground facilities such as tunnels and parking lots. Read OIZOM’s Whitepaper on location selection for more details.
(This article is part of a special Guest Column collaboration between Devic Earth and Oizom Instruments Pvt. Ltd. The original Article can be viewed here)
Looking for a reliable and effective Clean Air Solution for your premises? Click the below link to know the Top Industrial / Commercial Air Purifiers.

Authors:
Rudradutt Thaker & Dhyey Solanki
.webp?width=1080&height=1080&name=Free%20Case%20Study%20Steel%20Plant%20(1).webp)


Post Comments